
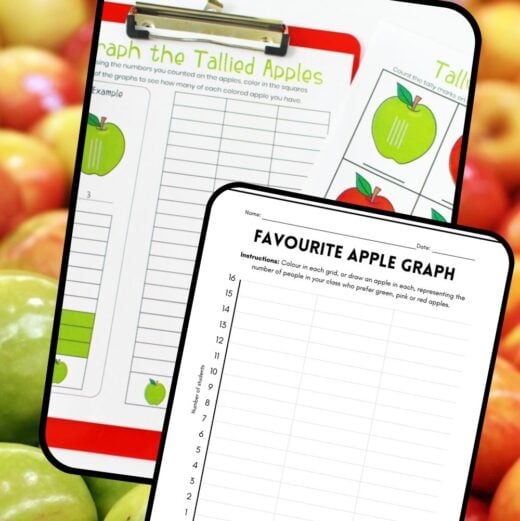
Turn apples into an easy fall math and STEM activity with this apple graphing project! Kids can practice tally marks, collect data, create a graph, compare results, and answer simple questions using apple-themed printables.
Use the activity on its own, or pair it with an apple taste test so students can graph their class favorites.
Apple Graphing Activity
Field: Math, STEM
Grades: K–3
Concepts: Graphing, tally marks, data collection, comparing quantities, interpreting graphs
💡 This printable gives kids two different ways to practice working with data.
They can first count tally marks and turn those totals into a graph, then collect real class data and create a Favorite Apple Graph using green, yellow, and red apples.
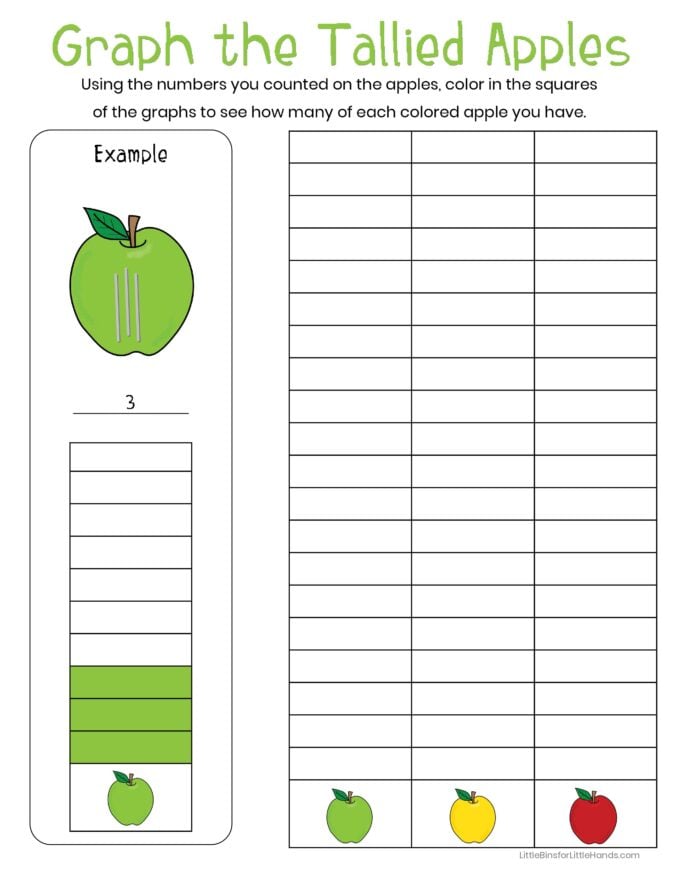
The class or group graph asks kids to color the grid or draw apples to represent how many classmates, friends, and/or family members prefer each apple color.
Supplies
- Apple Graphing printable pack
- Pencil
- Crayons or colored pencils
- Optional: red, green, and yellow apples for a class taste test
Free Apple Graphing Printable
Use the Apple Graphing printable for an easy fall math activity.
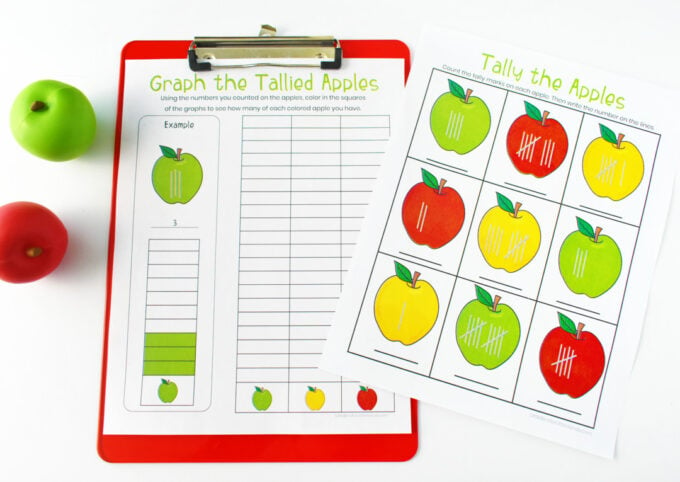
The printable set includes:
- Favorite Apple Graph
- Graph-reading questions
- Tally-mark practice
- Tally the Apples activity
- Graph the Tallied Apples activity
💡 The favorite-apple pages also ask students to identify the most and least popular choices, compare quantities, and represent results with tally marks.
Start With Tally Marks
Begin with the Tally the Apples page.
Kids count the tally marks shown on each apple and write the total.
This gives younger students practice with:
- Counting
- Groups of five
- Number recognition
- Tally marks
Once students record the totals, they can move on to graphing them.
Graph the Tallied Apples
Use the totals from the tally page to complete the graph.
Students color in the correct number of boxes for:
- Green apples
- Yellow apples
- Red apples
This helps kids see how the same information can be shown in two different ways: first with tally marks and then with a graph.
Make a Favorite Apple Graph
For a more hands-on version, turn the activity into a class survey.
🔎 Ask each student: Which apple do you prefer: green, yellow, or red?
Record the votes, then use the Favorite Apple Graph to show the results. Students can color each square or draw an apple for every vote.
💡 This is a simple way to introduce the idea that graphs help us organize information so it is easier to compare.
Read and Compare the Graph
Once the graph is complete, ask students to look closely at the data.
The printable includes questions such as:
- Which apple was most popular?
- Which apple was least popular?
- How many students preferred green apples?
- How many preferred yellow apples?
- How many preferred red apples?
- How many more students preferred one apple than another?
🔎 These questions help kids move beyond simply making a graph and begin interpreting data.
Pair It With an Apple Taste Test
This activity works especially well with the Apple Taste Test and 5 Senses Activity.
Let kids sample several apple varieties first. Then have everyone choose a favorite and graph the class results.
🔎 This creates a nice sequence: Observe → Taste → Choose → Collect Data → Graph → Compare
It also gives the graph real meaning because students are working with data they helped create.
Connect It to Apple STEM
Graphing adds a stronger math and data component to your apple theme.
👉 Pair this activity with your Apple STEM Activities for more hands-on engineering, building, fractions, and problem-solving ideas.
Guiding Questions
- What does each tally mark represent?
- Which apple has the most votes?
- Which has the fewest?
- How many more students chose one apple than another?
- What information does the graph show?
- How does the graph make the data easier to understand?
- Would the results change with another class?
- What other apple data could you graph?
Printable Apple Science and STEM Pack
Want more apple activities in one place?
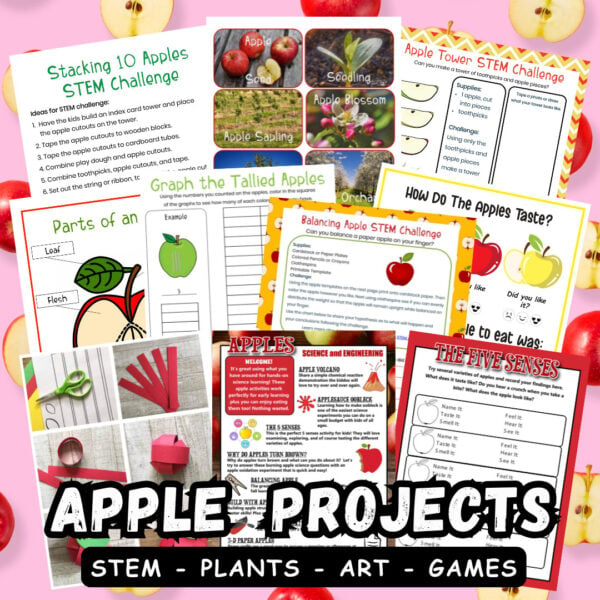
The Apple Science and STEM Pack includes more than 125 pages of apple-themed projects and printables for Kindergarten through elementary.
Inside, you’ll find apple science activities, STEM challenges, life cycle resources, observation pages, and additional printable activities for fall learning.
More to Explore
Apple STEM Activities | Apple Taste Test | Apple Observation Activity | Apple Fractions | Apple Science Experiments