Let’s explore the fascinating world of the human heart with this engaging heart rate experiment and science fair project! Kids will measure and analyze their heart rates during different physical activities, apply the scientific method, and explore how the heart pumps oxygen-rich blood through the body.

Heart Rate Science Project
Get your sneakers for this activity that gets you moving! Perfect for incorporating STEM, math, and biology. Also, it allows kids to work on data collection, observation, and analytical skills.
Grade Level: This project is perfect for grades 3 and older and can spark curiosity about health and fitness.
Scientific Question
ASK: How do different types of physical activities affect heart rate?
Hypothesis
Example: If a person engages in more vigorous exercise, THEN their heart rate will increase because the heart pumps more blood to supply the body with oxygen.
💡Learn more about how to write a hypothesis for kids here.
Supplies:
- Stopwatch or timer with a second hand
- Notebook or data sheet (free printable below)
- Pencil or pen
- Quiet space for measuring resting heart rate
- Graph paper (for plotting data on the x-axis and y-axis)
- Volunteers for participation (optional)
Heart Rate Experiment Instructions
🛑 Adults, please ensure that all kids can participate in a vigorous activity if applicable.
Step 1: Define Variables
- Independent Variable: Types of physical activity (e.g., walking, jump rope, vigorous exercise).
- Dependent Variable: Heart rate (measured in BPM or beats per minute).
- Controlled Variables: The person’s resting heart rate, activity duration, and environment.
Step 2: Measure Resting Heart Rate
- Locate your radial pulse (on the thumb side of your wrist) or carotid pulse (on the side of your neck).
- Use your opposite wrist and fingertips (not your thumb) to feel the pulse.
- Count the number of beats in 15 seconds and multiply by 4 to get BPM.
- Record the baseline (normal resting level).
Step 3: Conduct the Experiment
- Choose one activity, such as jump rope, and perform it for 1 minute.
- Immediately measure and record the pulse rate in BPM.
- Rest until your heart rate returns to its normal resting level.
- Repeat the experiment with different activities (e.g., walking, running, or using fun exercise equipment).
Step 4: Repeat and Collect Data
- Conduct three trials for each activity and record the results.
- For volunteers, include multiple participants to compare how a person’s heart rate varies.
Step 5: Analyze the Data
- Calculate the average heart rate for each activity.
- Create a bar graph with activities on the x-axis and BPM on the y-axis.
- Use the graph to identify patterns and trends.
Step 6: Draw Conclusions
- Was your hypothesis supported?
- Which activity caused the most significant increase in heart rate? Why?
- Discuss the importance of regular exercise and how a balanced diet supports a healthy heart.
Discussion Questions for Science Fair Presentation
💡Learn more about setting up science fair projects with kids.
- How does physical activity affect heart rate, and why?
- What role do muscles and oxygen play in increasing heart rate?
- Why does recovery time differ between activities or individuals?
Free Printable Heart Rate Experiment Worksheet

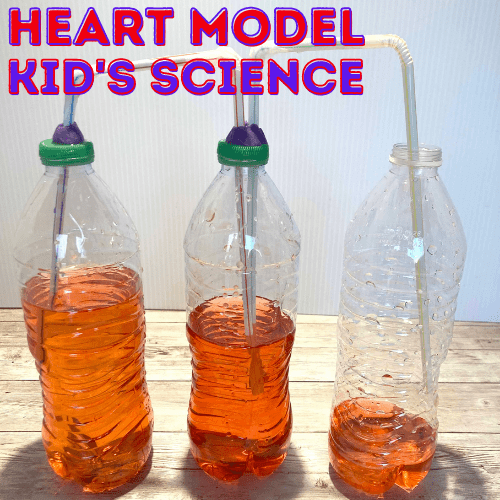
💡For an exciting hands-on addition, check out our DIY Heart Model project, which shows how the heart pumps blood through the body!
Scientific Method at Work
- Ask a Question: How does heart rate change during physical activity?
- Research: Use resources like the American Heart Association to understand the circulatory system.
- Form Hypothesis: Predict how the heart responds to physical exertion.
- Experiment: Test heart rate during various activities, measure recovery time, and analyze trends.
- Analyze Data: Use graphs to visualize results and compare activities.
- Conclusion: Summarize findings and their implications for heart health.
💡Learn more about the scientific method here.
What Will Kids Learn from This Heart Rate Experiment
- Understand the relationship between physical activity and heart rate.
- Learn to measure heart rate using a wrist pulse or thumb side pulse.
- Use data analysis skills to create and interpret graphs.
- Explore the heart’s role in delivering oxygen and nutrients to the body.


Helpful Science Resources
Here are a few resources to help you introduce science more effectively to your kids or students and feel confident presenting materials. You’ll find helpful free printables throughout.
- Printable Science Project Pack 👇
- Best Science Practices (as it relates to the scientific method)
- Science Vocabulary
- All About Scientists
- Free Science Worksheets
- DIY Science Kits
- Science Tools for Kids
- Scientific Method for Kids
- Citizen Science Guide
- Join us in the Club